PiLAB stands for passive imaging of the lithosphere-asthenosphere boundary. The main objective of the experiment is to determine what makes a plate ‘plate-like’. I have a lecture that I give to second or third year students which is entitled ‘What is a plate?’. For such a simple question the answer is not as straight-forward as one might imagine – after all, ‘plates’ are fundamental components of the plate tectonic paradigm, which has been central to the Earth Sciences since the 1960s. To address this question we will be using a variety of geophysical methods for imaging a plate, including ocean bottom seismometers and magnetometers – but more about these later.
Our experiment is funded by the Natural Environment Research Council (NERC) and the project is led by Dr. Kate Rychert with Dr. Nick Harmon of the University of Southampton and myself as co-investigators. I feel fortunate to have been invited to join this project at the proposal stage. Since receiving funding from NERC, Kate was also awarded a European Research Council (ERC) starting grant, which adds substantial further funding to the project.
The project has also taken on a significant international dimension, with partners from France, Germany and the USA. Scientists from the Institut de Physique du Globe de Paris (IPGP), the Scripps Institution of Oceanography (SIO) at the University of California San Diego, and the Lamont Doherty Earth Observatory (LDEO) at Columbia University are providing ocean bottom seismometers. SIO scientists are also deploying ocean bottom magnetometers.
When I started my research career, it was difficult to deploy a seismometer on the sea bottom for more than a week. Improvements in hard-disk storage, electronics, batteries and clocks, and developments in broad-band instruments have led to dramatic improvements in the last 10 years. Our instruments have been happily recording data from the bottom of the sea for nearly 12 months. A cruise on the R/V Marcus G. Langseth in March 2016 deployed seismometers and magnetometers near the equator in 3 fairly linear profiles from the Mid-Atlantic Ridge towards West Africa. Our current cruise on the RRS Discovery will pick up these instruments.
The broader project is also greatly enhanced by seismic surveys using human-made seismic sources (seismic refraction and reflection experiments). Prof. Satish Singh from IPGP was awarded an ERC advanced grant, which funded a cruise where data were acquired using active seismic sources (airguns) recorded by a long streamer of hydrophones. This experiment is a bit unusual in that it is a commercial scale operation using a Schlumberger ship. Furthermore, later this year Prof. Ingo Grevemeyer from GEOMAR in Kiel, Germany will record seismic signals from a ship using an array of ocean bottom seismometers. In total, 4 cruises over nearly 20 weeks will involve 7 principal scientists from 4 countries, and over 50 support scientists, including PhD students and postdocs. Our originally conceived NERC project has grown considerably – thus showing the value of international collaboration.
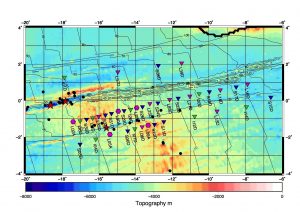
A map of the PiLAB stations. Colour shows the sea bottom topography (depth in meters). Magenta symbols show locations of LDEO instruments, blue those of SIO, and green those of IPGP. Thin black lines show the age of the tectonic plate, increasing from 0 million years old (Ma) at the Mid-Atlantic Ridge to 100 Ma in the northeastern section. The Mid-Atlantic Ridge lies in the centre of topographic highs (orange region). Between segments of the ridge the plates slide past each other along transform faults, but the scars of these faults are preserved as fracture zones visible across most of the ocean basin. A number of fractures zones trend E-W across our region, the largest of which is the Romanche Fracture Zone, which crosses the equator. The Chain Fracture Zone lies between the two southernmost lines of instruments. The 3 red stars are earthquakes in the last year on these fracture zones that are greater than magnitude 6.5. The black circles show other large earthquakes in the past year, which have been located using global seismic networks (generally > Mw5). Our dense seismic array has been detecting orders of magnitude smaller earthquakes, as well as large distant earthquakes from other parts of the Earth.